, a regular look at how people discover and buy video games in the 2020s.]
So, here we go - it’s the results of this newsletter’s gigantic dev survey on how many sales per review Steam games have. And before I present the results, just wanted to make sure we were on the same page about why it’s important, and what the numbers mean.
Why do we care about sales/reviews ratios?
It goes like this: we would love to know roughly how many copies of games are sold on Steam, for comparison and planning reasons when we make games. That data is not public. But the number of player reviews is public. So historically, there’s been the Boxleiter number, most recently updated by Jake Birkett in 2018.
So what I’m going to call these new results is ‘the NB number’, or New Boxleiter number (hi Mike Boxleiter, whom this is named after, btw!) And it turns out these numbers - we now have data per year - have indeed been changing quite a bit.
As I noted in my original call for data, Steam introduced a ‘would you like to review this?’ button (shown below) at the end of October 2019. This turns up sometimes when you’ve played a game for more than 2-3 hours and haven’t reviewed it yet:
This has led to lots more reviews of older games. And has definitely changed things for games launching after this UI tweak. So let’s get to it.
Introducing.. the actual ‘NB number’ dataset!
Starting out, here’s a sweep of all the data I got. Note that I did remove a handful (10-ish) of outlying data points - mainly from F2P games that had very high review/sales ratios because they were free to download, and a couple of incomplete submissions.
So over the 237 (!) non-outlying Steam games that submitted data to us, it’s
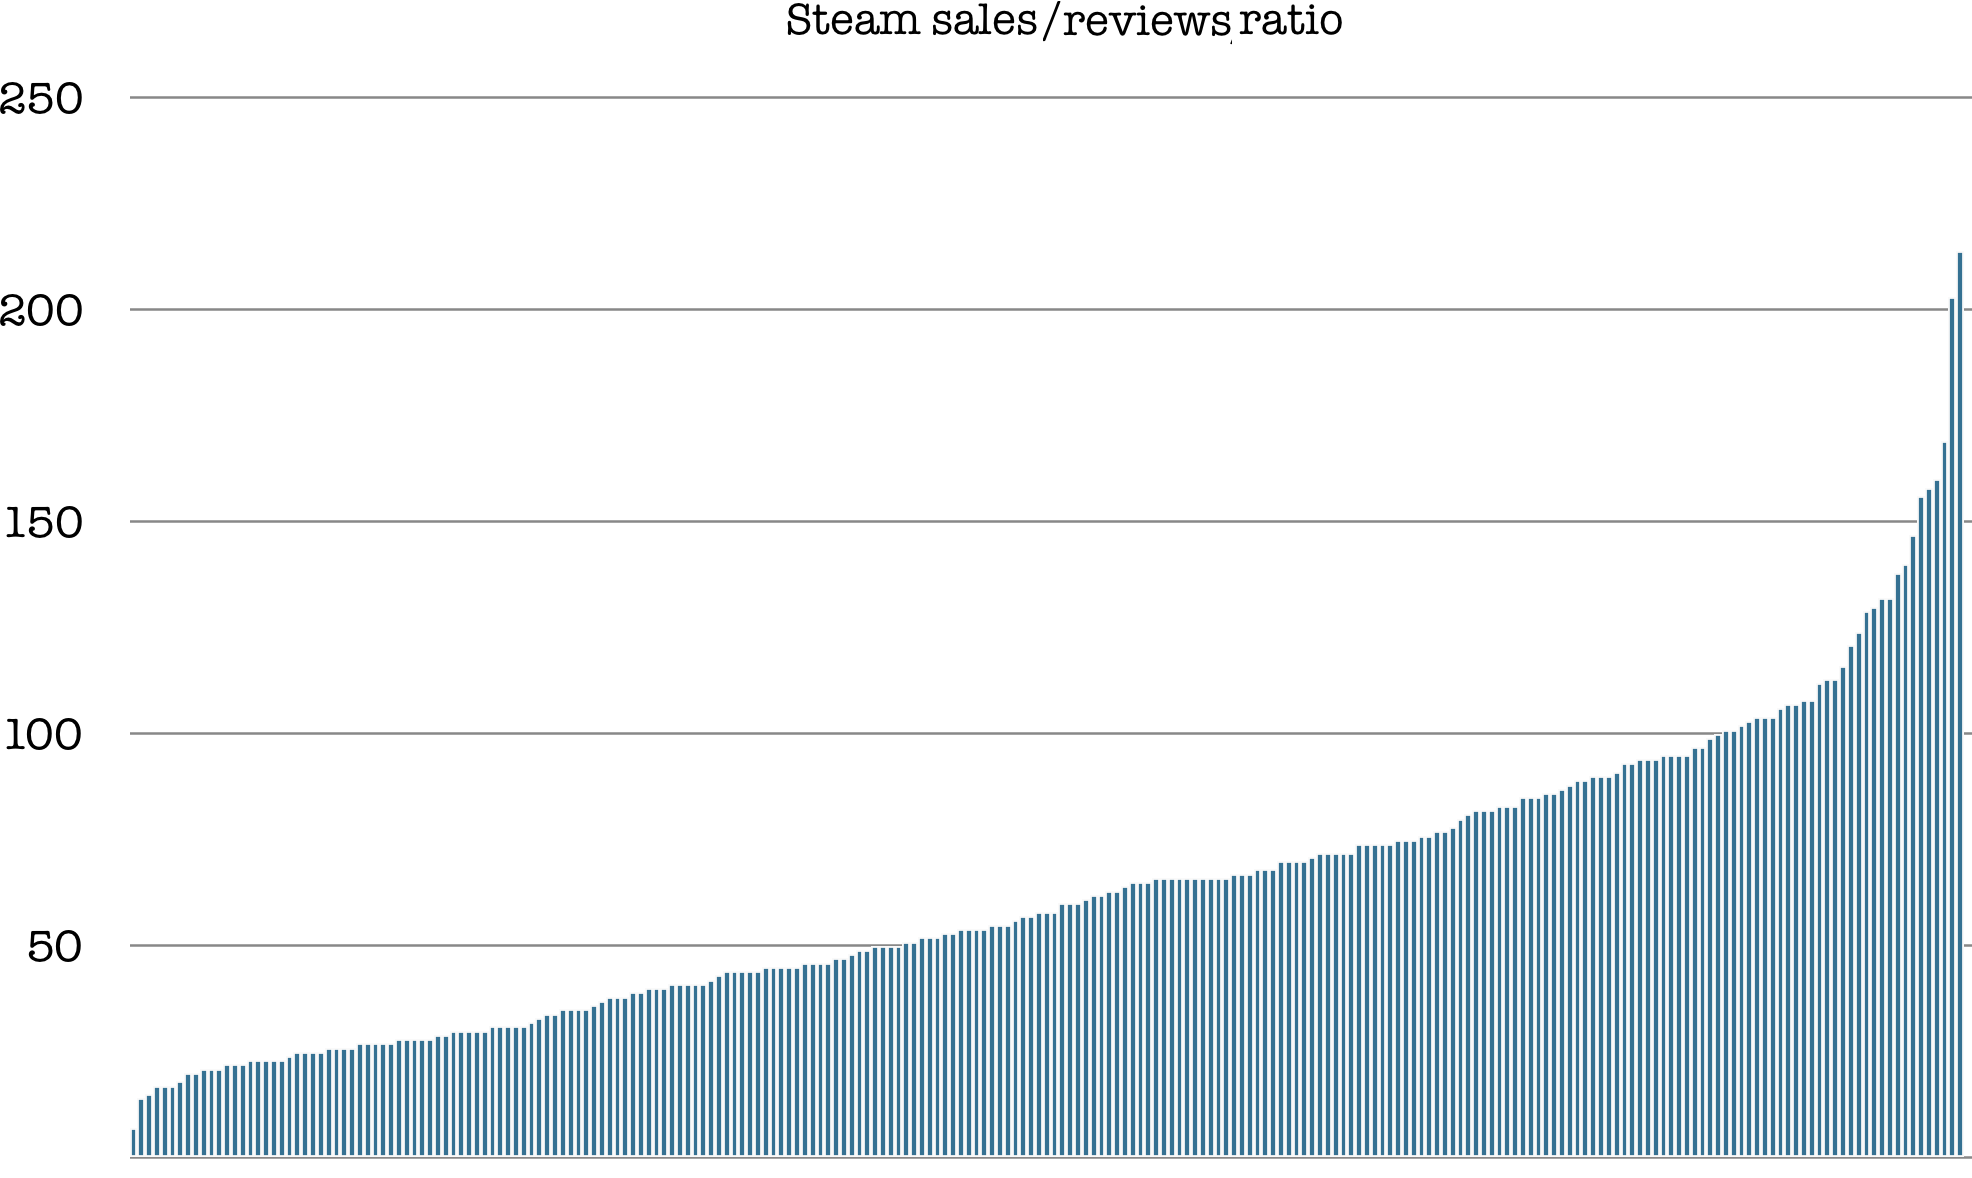

an ‘NB number’ average of 63 sales per review, and a median of 58 sales per review. Thus, if you’re looking at a Steam game of indeterminate age, that’s the kind of lens you can put on it.
The middle 80% of the sample is roughly between 25 and 100 sales per review, so that’s a good range to consider, if you’re not looking at year of launch so closely.
(BTW, if we go back to Jake Birkett’s survey data from 2018, the numbers were quite a bit higher - 82 sales per review as an average, and a median of 77 sales per review. So it’s definitely been coming down, as more people are encouraged to review games by Steam - and even before then.)
Regarding year of launch, we can see that there’s a pretty large difference in average/median sales per review, depending on when a game launched:

So if you launched your game before 2017, you still have an ‘NB number’ average of 81 sales per review and a median of 74 sales per review. But if you launched your game in 2019, when that significant change occurred, you have an ‘NB number’ average of 57 sales per review and a median of 51 sales per review.
And most pertinently, if you launched your game in 2020, you have an ‘NB number’ average of 41 sales per review and a median of 38 sales per review. And it seems like the current non-outlier range is between 20 and 60 sales per review - for a game launching from scratch this year.
Since many of us care about the present day, here’s the data set of ‘sales per review’ purely for games launching in 2020:

In many ways, don’t forget, more reviews is good for games, since a prospective player can see more feedback. BTW, the average Steam review score of those responding was 84% positive, and the median was 89% positive.
There was no major review positivity difference I could see after the ‘review prompt’ was added. I may put out some bonus graphs around review score and copies sold in subsequent newsletters, since there were a couple of interesting trends to highlight.
Before and after review prompts…

Just to reinforce why looking at review/sales ratios per year is important, Erik Rydeman from Clone Drone in the Danger Zone dev Doborog pinged me as I was prepping this newsletter, and said:
“I think you're absolutely right to take the changes with Steam encouraging reviews into account. Our lifetime sale/review ratio is 30, but looking at the range from only this year it's 14. Looking at 2017-2019 it's 67. Spot the point where Steam changed their UI!”

And wow, he’s right! I checked some other games that I have access to sales data on, and I think Clone Drone is a bit of an outlier.
It’s great, has repeat players, and thus had a lot of folks who had never got round to reviewing it, but were still playing. Nonetheless, Erik’s game is ‘catching up’ on reviews from people who bought a long time ago, thus the super low NB number in 2020 alone.
But the effect can be there, if less pronounced, with most Steam games that had been live for a while by October 2019. (Some exceptions exist - if your game is ‘one and done’ and older purchasers played through it once, even a high selling title won’t have got extra reviews from the reminders. New players will still get prompted, of course.)
Conclusion: do your math(s) right!
Anyhow, that’s your data! Hope you find it helpful. Before we conclude, just a reminder, in the classic ‘jumping to conclusions about if devs are millionaires or not’ fashion.
If you think a game has sold 20,000 copies using the NB number, and you want to work out how much money that title made, please don’t multiply that by its regular Steam USD store price and think that’s the money received in the dev’s pocket.
You’ve got to factor in average ‘regular’ price on Steam, how much and how often the game was on sale, and then after the money comes in, Steam platform cut, refunds, and VAT before you even get close to working out the real number. (Realistically, that’s 30%-50% of the ‘optimistic’ gross number, and potentially way less, if discounting is aggressive.)
Video games, eh? But we still all like playing them.
Take care until next time,